Together Redefined: Discover Our Rebranding Trailer. Watch Now!
yaveon favicon bildmarke
Icon weiße Lupe

Yaveon Power BI Cockpits

Make informed decisions and gain instant transparency with our ready-made BI cockpits.

Transparent: Real-time overview of business processes

Versatile: for sales, purchasing, finance, and more

Integrated: directly into Business Central and Yaveon 365

Darstellung eines digitalen Schlosses mit Binärcode

More than 850 companies worldwide rely on Yaveon

logo kunde hosta
logo kunde midas
logo kunde sanity-group
logo kunde drschnell
logo kunde frei-oel
logo kunde ravenoel

How our BI Cockpits enhance your data analysis.

Keeping an eye on complex processes

Power BI dashboards provide clear insights into your production metrics. Keep an eye on lead times, capacity utilization, and quality at all times.

Quality from the start

With our BI dashboards, you can identify process weaknesses and detect negative or positive trends in product quality early, ensuring compliance with standards.

Respond flexibly to changes

Fluctuating prices and availability? The dashboards display trends so you can manage your procurement based on data and ensure supply.

Data where you need it 

The BI cockpits can be flexibly used in the plant, laboratory, or management, ensuring that information is available for informed decision-making.

Seamlessly integrated & intelligently connected.

Our Power BI dashboards integrate seamlessly with Business Central and the industry-specific ERP solution Yaveon 365—no need for exports or detours. Analyze your data exactly where it originates. The result? Greater transparency, increased efficiency, and the key competitive edge needed for growth.

The Yaveon Power BI Cockpits at a glance

Quality control
Sales
Purchase
Incident

Power BI Quality Control Dashboard

Ensure quality and customer satisfaction by maintaining an overview and taking targeted actions for products that impress.

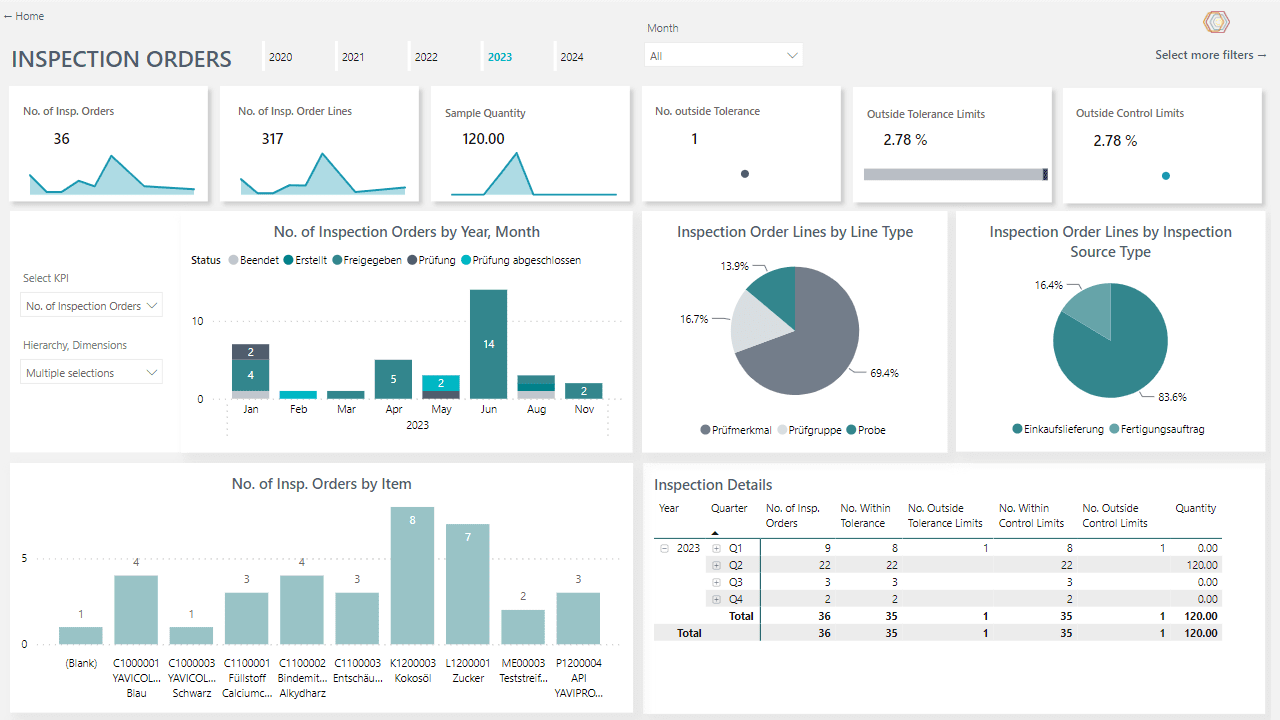
Quality tracking of features, items, and suppliers

Identification & analysis of faulty inspection orders

Insight into purchased quantities & delivered quality 

Screenshot out of the Power BI Quality Assurance Cockpit

Power BI Sales Cockpit

Increase your revenue with data-driven insights. Our Sales Cockpit optimizes your sales process for precise, efficient results.

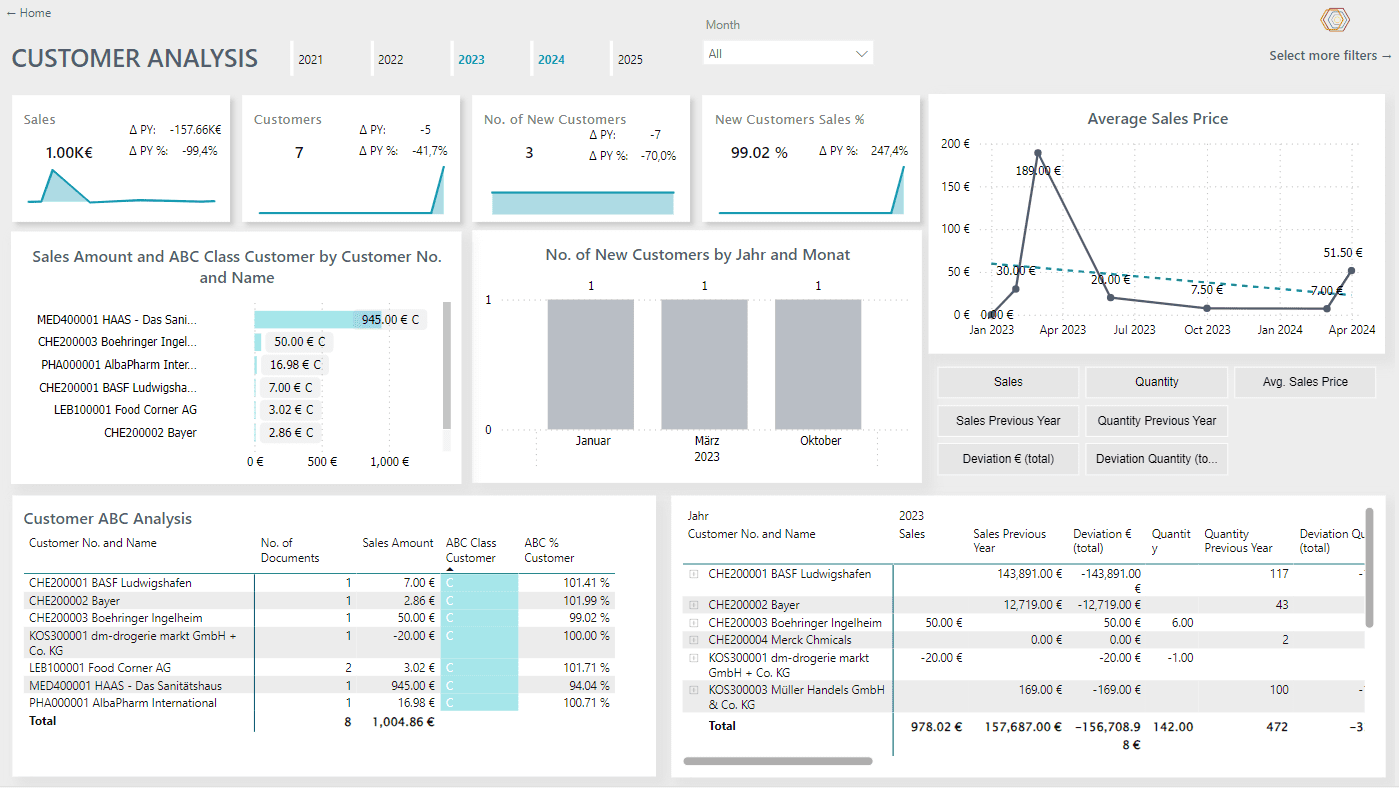
Analysis of sales and cumulative evaluations over time

Customer and item analyses, including ABC and new customer analysis

Flexible selection of key figures and dimensions for analysis

Order backlog for identifying pending warehouse receiving

Screenshot of the Power BI Sales Cockpit

Power BI Purchase Dashboard

Keep a close eye on your purchasing process. The Purchase Cockpit provides up-to-date data for seamless operations and maximum efficiency.

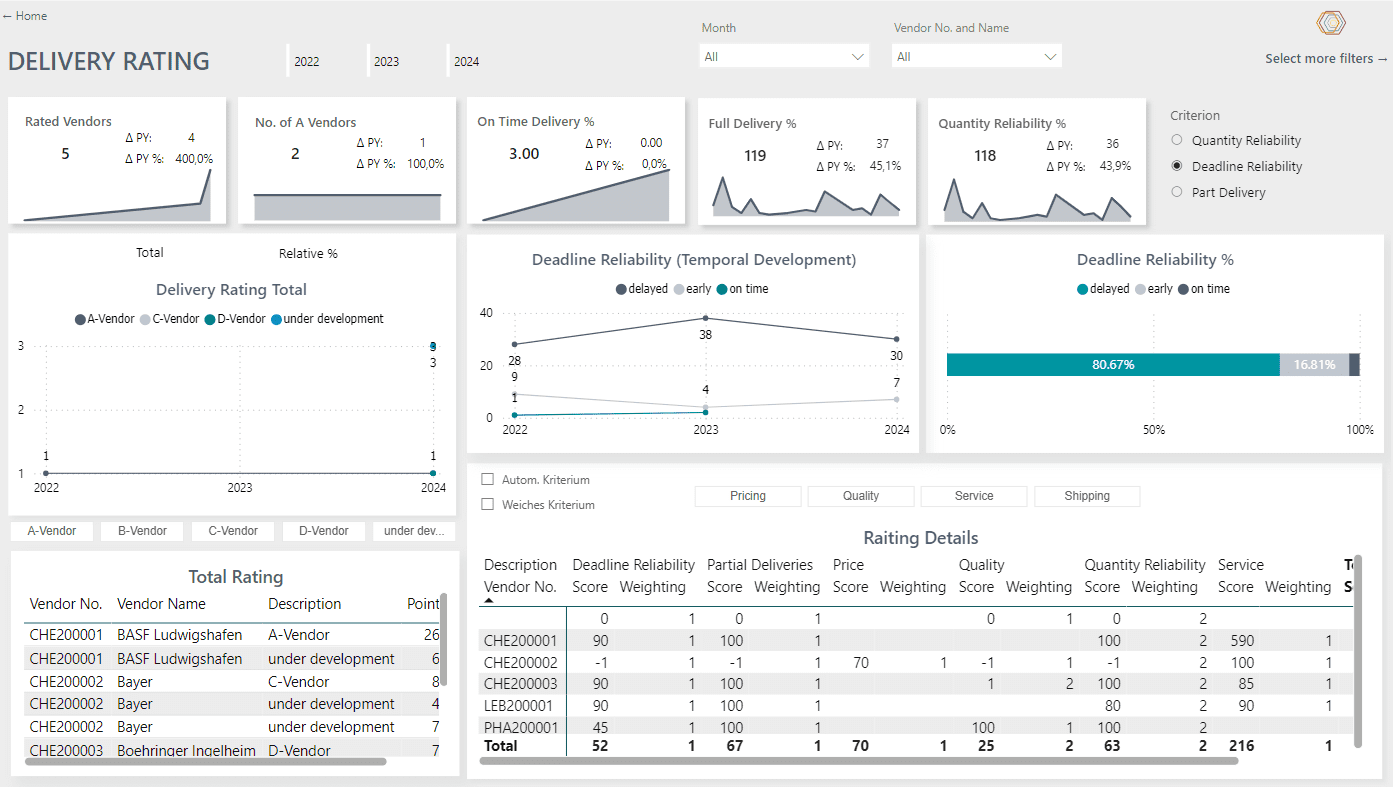
Overview of completed purchases including variance analyses

Evaluation of purchase order stock and delivery backlog

Accounts payable and item analysis, including ABC analysis

Supplier quality evaluation and development analysis

Screenshot out of the Power BI Purchase Cockpit

Power BI Incident Management Dashboard

With the cockpit, analyze the sources, origins, and reasons based on data to effectively resolve issues in the supply chain.

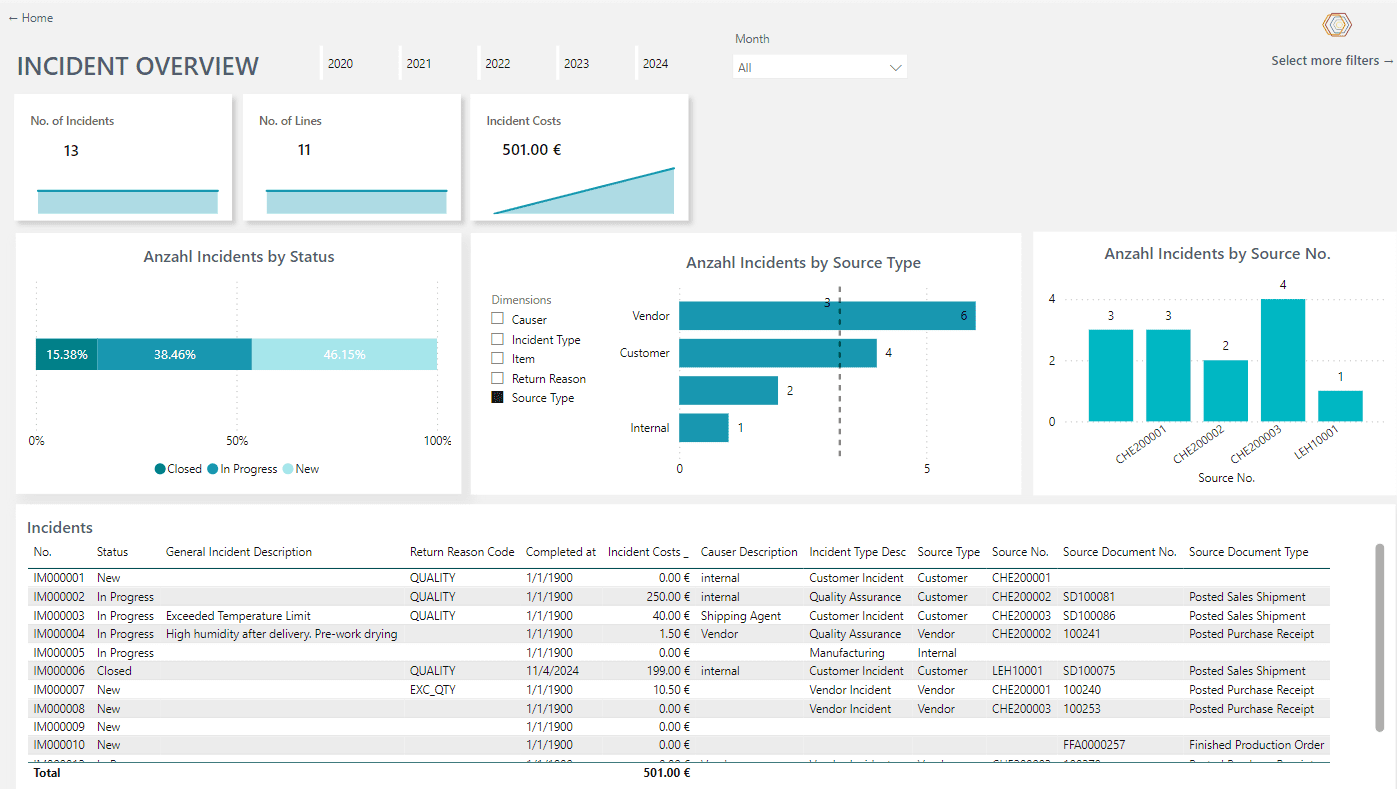
Overview of the recorded incidents and their status

Identification of overdue actions for incident resolution.

Analyze supply chain issues reliably and transparently

Comparison of incidents, such as those from suppliers

Screenshot out of the Power BI Incident Management Cockpit
Zitat Icon
The implementation of Yaveon BI was smooth, and we were very satisfied during the implementation. Our consultants always listened to and understood us.
— Susann Meden, hameln pharma GmbH
Icon Yaveon Favicon

Frequently asked questions about the Yaveon Power BI Cockpits

What is a Yaveon Power BI dashboard?

A Yaveon BI Cockpit is a digital analysis integrated into Microsoft Power BI. It allows the display of data relevant to a specific target audience.

In which areas does Yaveon offer Power BI dashboards?

Yaveon Power BI Cockpits are available for the areas of sales, purchase, incident, and quality management.

Why use Power BI dashboards?

BI Cockpits enhance the efficiency of working with Power BI by providing comprehensive data displays tailored for specific processes.

Is it possible to extend the Yaveon Power BI dashboards?

Yes, you can customize and add additional Yaveon BI Power Cockpits at any time.

What is the difference between BI cockpits, BI dashboards, and BI reports?

BI cockpits are digital templates for data displays specifically designed for certain target groups. BI dashboards refer to any analysis view created with Power BI. A Power BI report is the result generated by users based on the analyses conducted with Power BI.

How long does it take to implement BI Cockpits?

The dashboards can be implemented in just a few days. We install the dashboards into your Power BI and connect them with your Business Central. Everything is prepared for you to quickly gain new insights into your data.

Trends, tips & events:
current insights

The digital potential of the process industry The digital potential of the process industry – Beitrag öffnen
The digital potential of the process industry

We show you how the process industry can discover and unleash its greatest digital potential.

Success story: Hameln Pharma Success story: Hameln Pharma – Beitrag öffnen
Success story: Hameln Pharma

Read how hameln pharma connects an external warehouse largely with a standard interface and saves time through automated processes.

Success story: Remar Success story: Remar – Beitrag öffnen
Success story: Remar

Remar breaks ERP boundaries with the Power Platform and automates booking requests – read the report now!

Yaveon Favicon
More than 850 companies trust Yaveon as their ERP partner of choice
Yaveon Favicon
© 2025 Yaveon. All rights reserved.
crosschevron-down