
BI Cockpits from YAVEON
How to evaluate your data for specific target user groups
Target-oriented and clear: YAVEON cockpits to get even more out of Power BI
Incoming payments are not relevant to the manufacturing team. Just as the sales team doesn’t need to know about the materials used. Each department has its own priorities and only needs information relevant to them to be displayed. This is precisely what the YAVEON Business Intelligence Cockpits do. They are digital templates that present evaluations to targeted user groups.
Target your Microsoft Power BI even more effectively. Create a report, then filter it with the BI Template to adapt it for the respective user group. Base your decisions on more relevant insights.
Our BI Cockpits are available for the following areas:
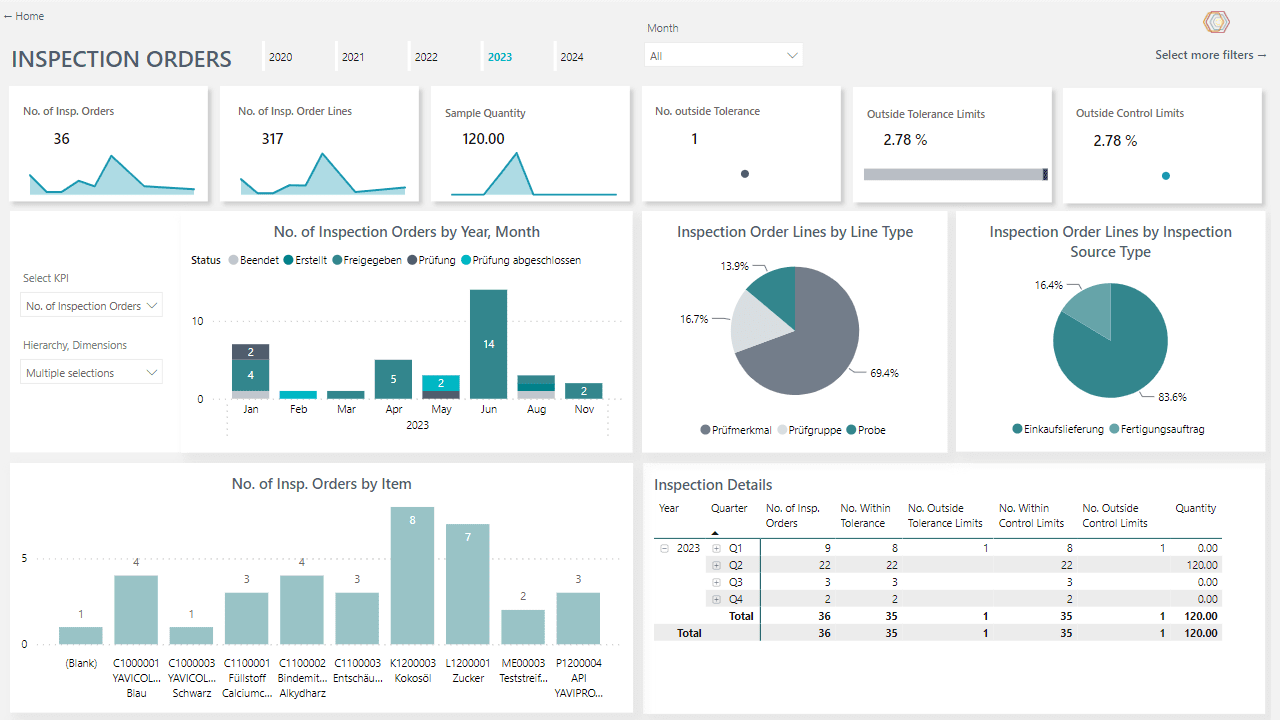
Power BI Quality Control Cockpit
Satisfied customers due to high quality and efficient production. Our Quality Control Cockpit gives you a comprehensive overview of your item quality and the responsiveness to act when needed. All based on Business Central inspection orders. The result is products that impress your customers.
The highlights:
- Quality tracking of various characteristics, articles, or suppliers over time and tracking of the limit values to identify excess and shortfalls.
- Identification and analysis of faulty or out-of-tolerance test jobs.
- Depiction of correlations between purchased quantity and delivered quality.
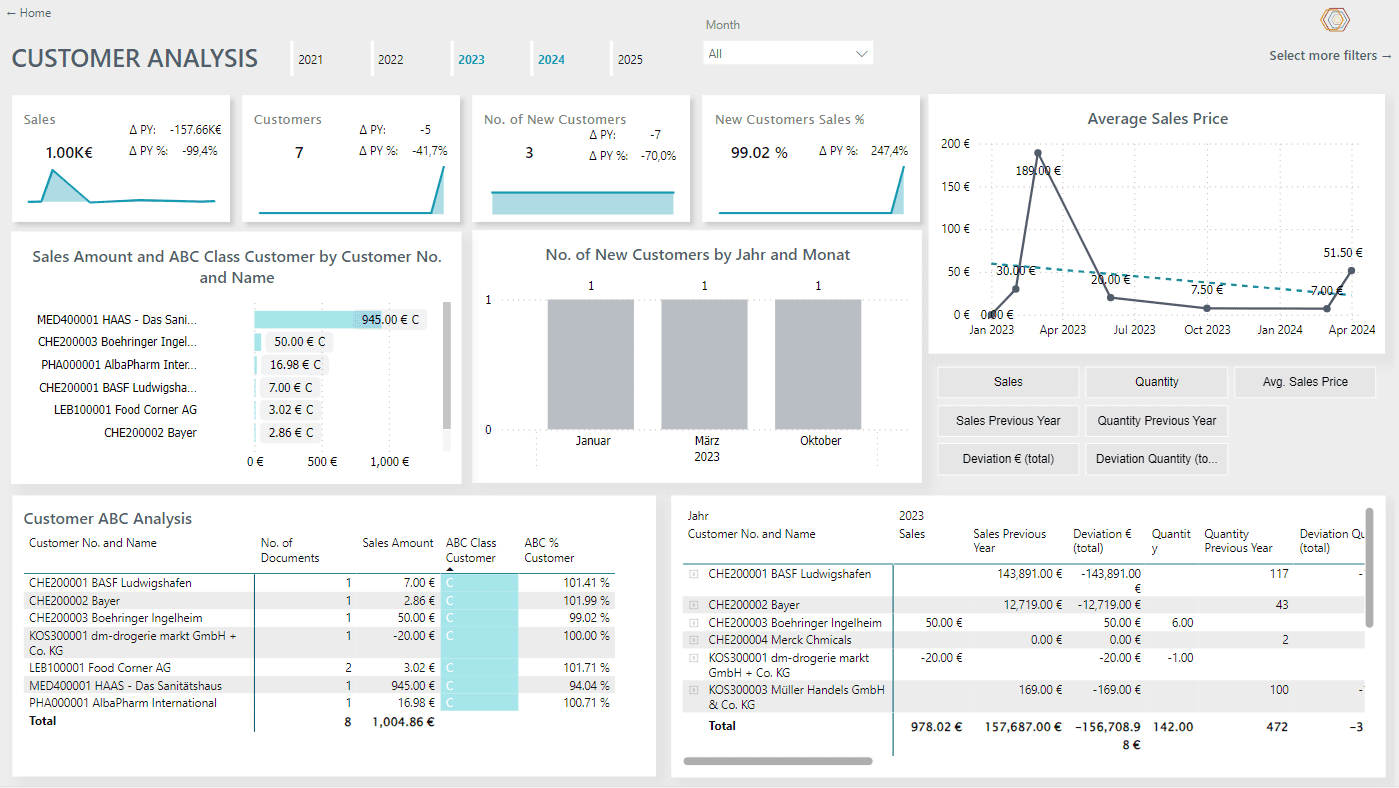
Power BI Sales Cockpit
Your data-based sales boost. Our Sales Cockpit provides you with the relevant data, based on all available figures and information, so that you can optimize your sales process. The result is a precise sales cycle, based on data.
The highlights:
- Flexible analysis of sales including previous year or variance analyses and cumulative evaluations over time
- Accounts receivable and article analysis including ABC, new customer and price development analyses
- Order backlog to identify outstanding incoming goods.
- Flexible selection of various key figures and dimensions for evaluation in a selection of different display options
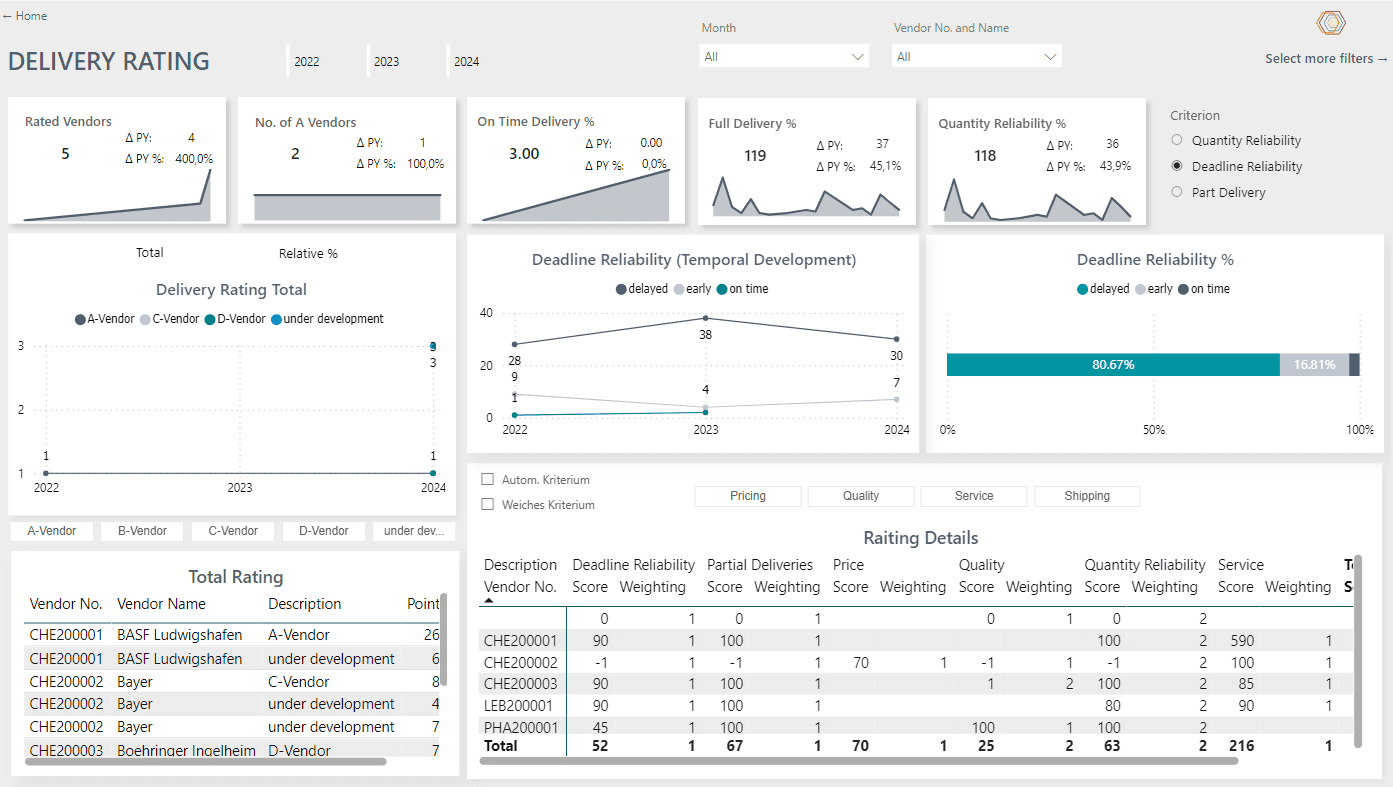
Power BI Purchase Cockpit
Closely track your entire purchasing process. With our Purchase Cockpit, your purchasing system is kept up to date at all times, because all information is based on the currently imported data. The result is smooth purchasing mechanisms when you need them.
The highlights:
- Overview of purchases made including previous year or variance analyses and cumulative evaluations over time
- Flexible selection of various key figures and dimensions for evaluation in a selection of different display options.
- Evaluation of the order backlog and delivery backlog to identify outstanding purchase orders.
- Supplier evaluation to analyze your supplier quality and its development according to various quality criteria.
- Vendor and article analysis including ABC analysis.
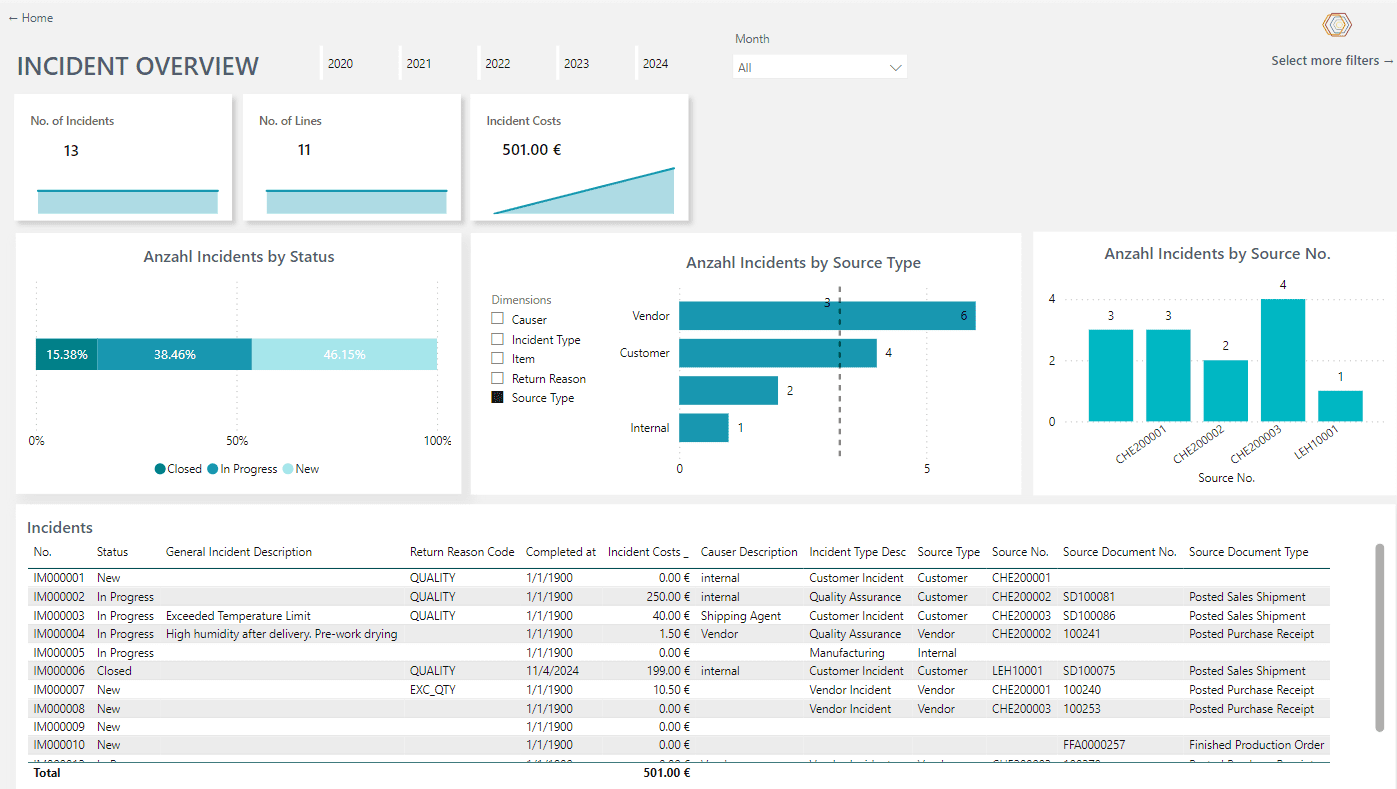
Power BI Incident Management Cockpit
Always maintain an overview of your complaints and incidents: Our Incident Management Cockpit provides a wealth of information so that you can derive detailed insights into the originators, types of origin and reasons for various complaint cases. The benefit for you: data-based analysis options for seamless monitoring of supply chain problems.
The highlights:
- Always maintain an overview of the recorded incidents and their status
- Identify overdue measures to eliminate incidents
- Reliably and transparently analyze supply chain problems
- Comparison of incidents involving suppliers, customers, articles or batches
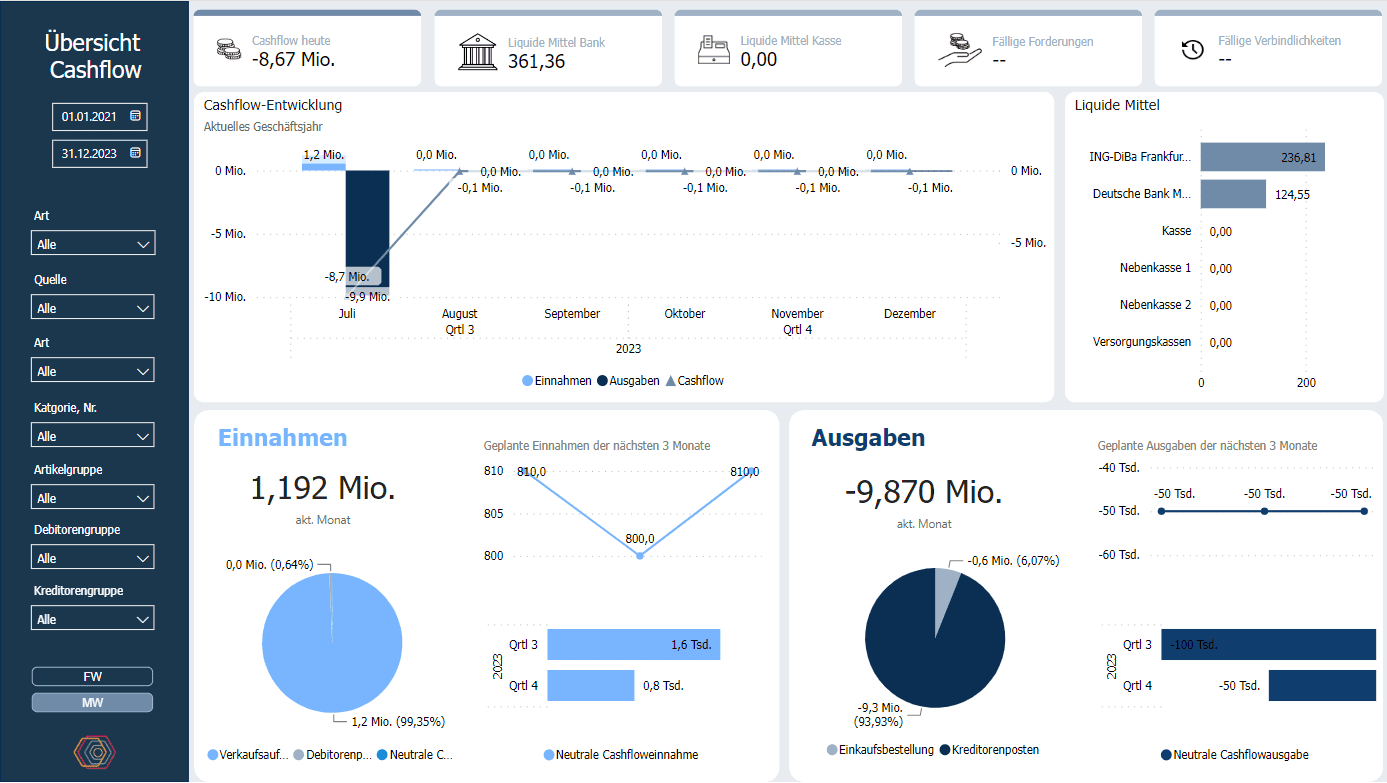
Power BI Cashflow Cockpit
Bring transparency to your finances: With our Cashflow Cockpit, you can monitor your cash flow and make data-based decisions. Providing the perfect foundation for long-term business success.
The highlights:
- Analysis of the factors that affect cash flow, via cash inflows and outflows, such as receivables or payables.
- The ability to select influencing factors provides a flexible analysis while taking foreign currency into account.
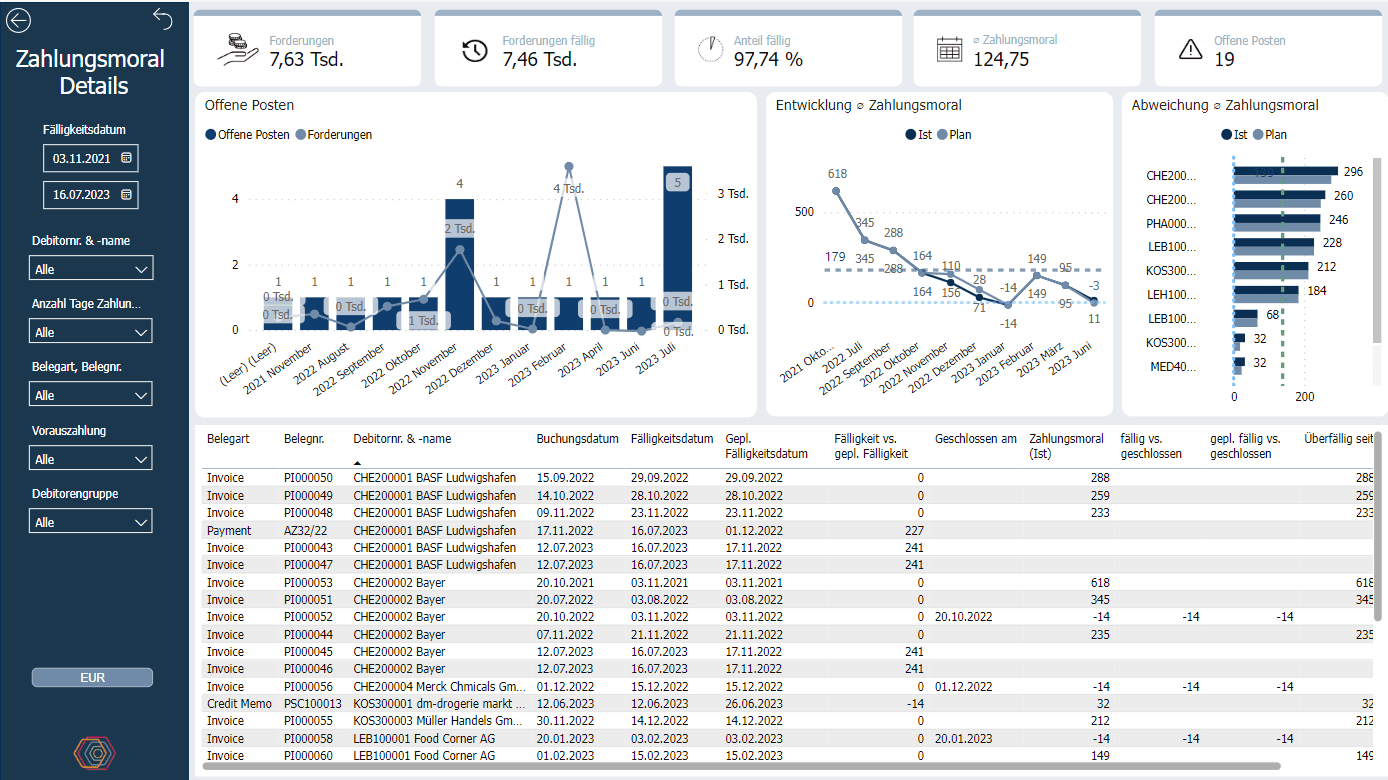
- Analysis and evaluation of debtor payment behavior and detection of trends
- Comparison of the planned and actual payment terms of your debtors
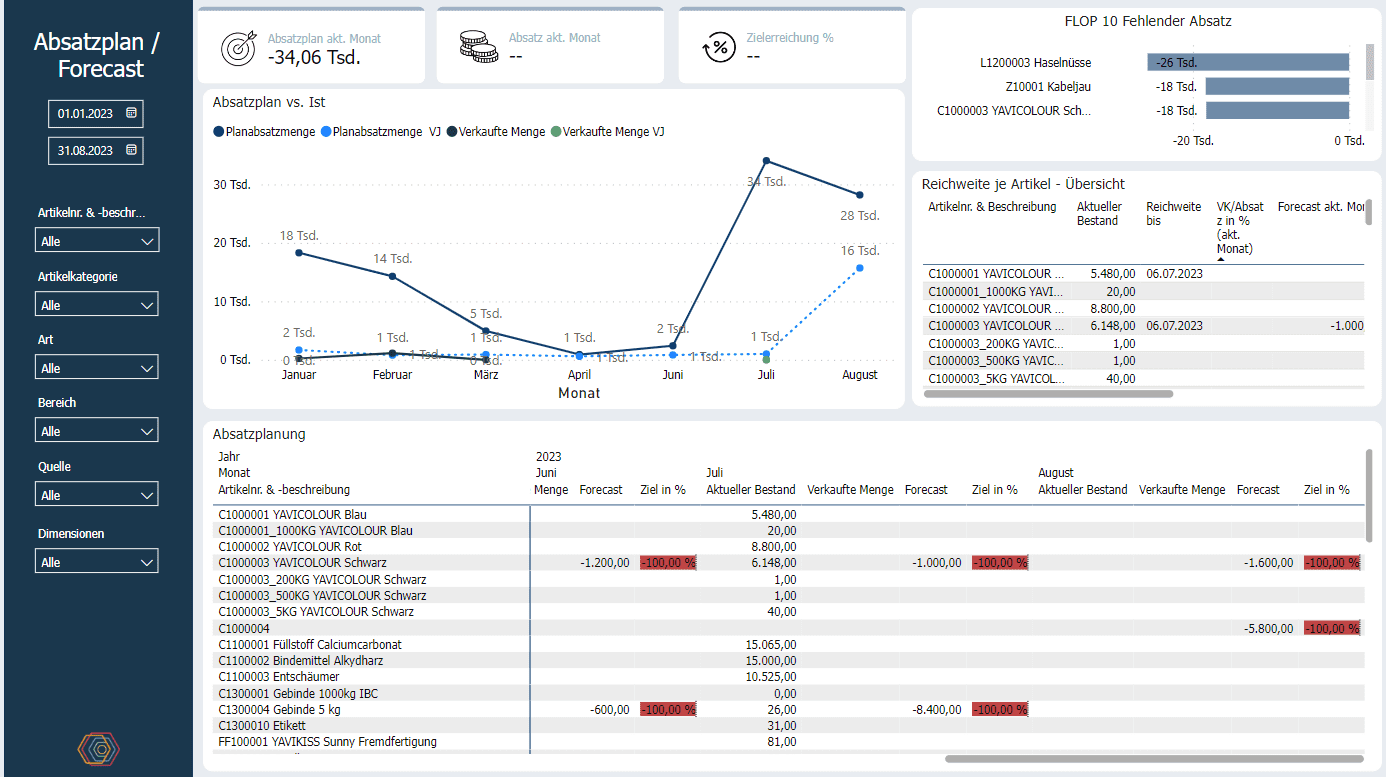
Power BI Range Planning Cockpit
An intelligent approach to your warehouse and production. Our range planning cockpit reliably shows which items are in your inventory, in what quantity, and when they are ready for use, while highlighting critical bottlenecks. The result is realistic and secure planning.
The highlights:
- Monitor inventory levels to identify overdue inventory, high inventory costs, and how much capital is tied up by inventory.
- Comprehensive view of range planning due to the combination of sales planning from Business Central with forecast analysis.
- Item coverage in days by showing shortage and surplus of items.
Power BI Finance Cockpit
Maintain full control over your finances with one click. With our Finance Cockpit, you can digitally compile accurate balance sheets, sales figures, reports, etc. with ease. The result is reliable insights, reports, and analyses in no time.
The highlights:
- Periodic activities such as (condensed) balance sheets and income statements.
- Actual status and forecast development, including current inventory value by booking group, and category development over time.
- Display of overdue items with suggestions for reminders and the blocking of items for reminders.
- Create sales reports and statistics using daily sales, liquidity trends, payment tolerance, cash discounts, and more.
- Display and check vendor master data and vendors blocked for payment.
- Display open items such as credit memos and subscription account payments, items due in the next three days, invoices to be posted, and more.
- Show customers and create reports, including daily sales, cash discounts, payment history, and more.
The main advantages of YAVEON Cockpits
Born from experience
The only question is: How does YAVEON know which key figures in a business intelligence cockpit are really relevant for the targeted user group? The answer is simple: from years of experience gained in numerous customer projects. All this knowledge and know-how is now bundled in the YAVEON Cockpits.
YAVEON consultants know the requirements of the respective user groups and have consolidated this knowledge in our Cockpits. The result is the Power BI templates. We want to pass on this expertise to our customers - the combination of implementing Microsoft Power BI and Cockpits so that you can use the BI solution that suits your needs right from the start.
As individual as your evaluations:
You can choose between these access modes for your YAVEON BI cockpits
Microsoft Power BI service:
- Cloud-based SaaS service with all available Power BI features
- Especially suitable for users who work from a fixed device
- Integration of YAVEON Cockpits for a consistent user experience
Microsoft Power BI Mobile:
- Displays the YAVEON Cockpits via mobile devices even when on the go
- Usable from (almost) everywhere
- Available for Windows, iOS, and Android devices and downloadable via the respective app stores
Questions are there to be answered.
FAQs about BI Cockpits from YAVEON
Individual, Non-Binding & Not Complicated
In 3 steps to your individual live presentation
Get in touch
You are interested in a YAVEON solution? Get in touch with us - it's completely non-binding.
Requirements specification
Let's specify your requirements for the live presentation together in a short call.
Enjoy your live presentation
Let's start: Get to know the possibilities YAVEON has to offer. Enjoy a live presentation tailored to your needs.